
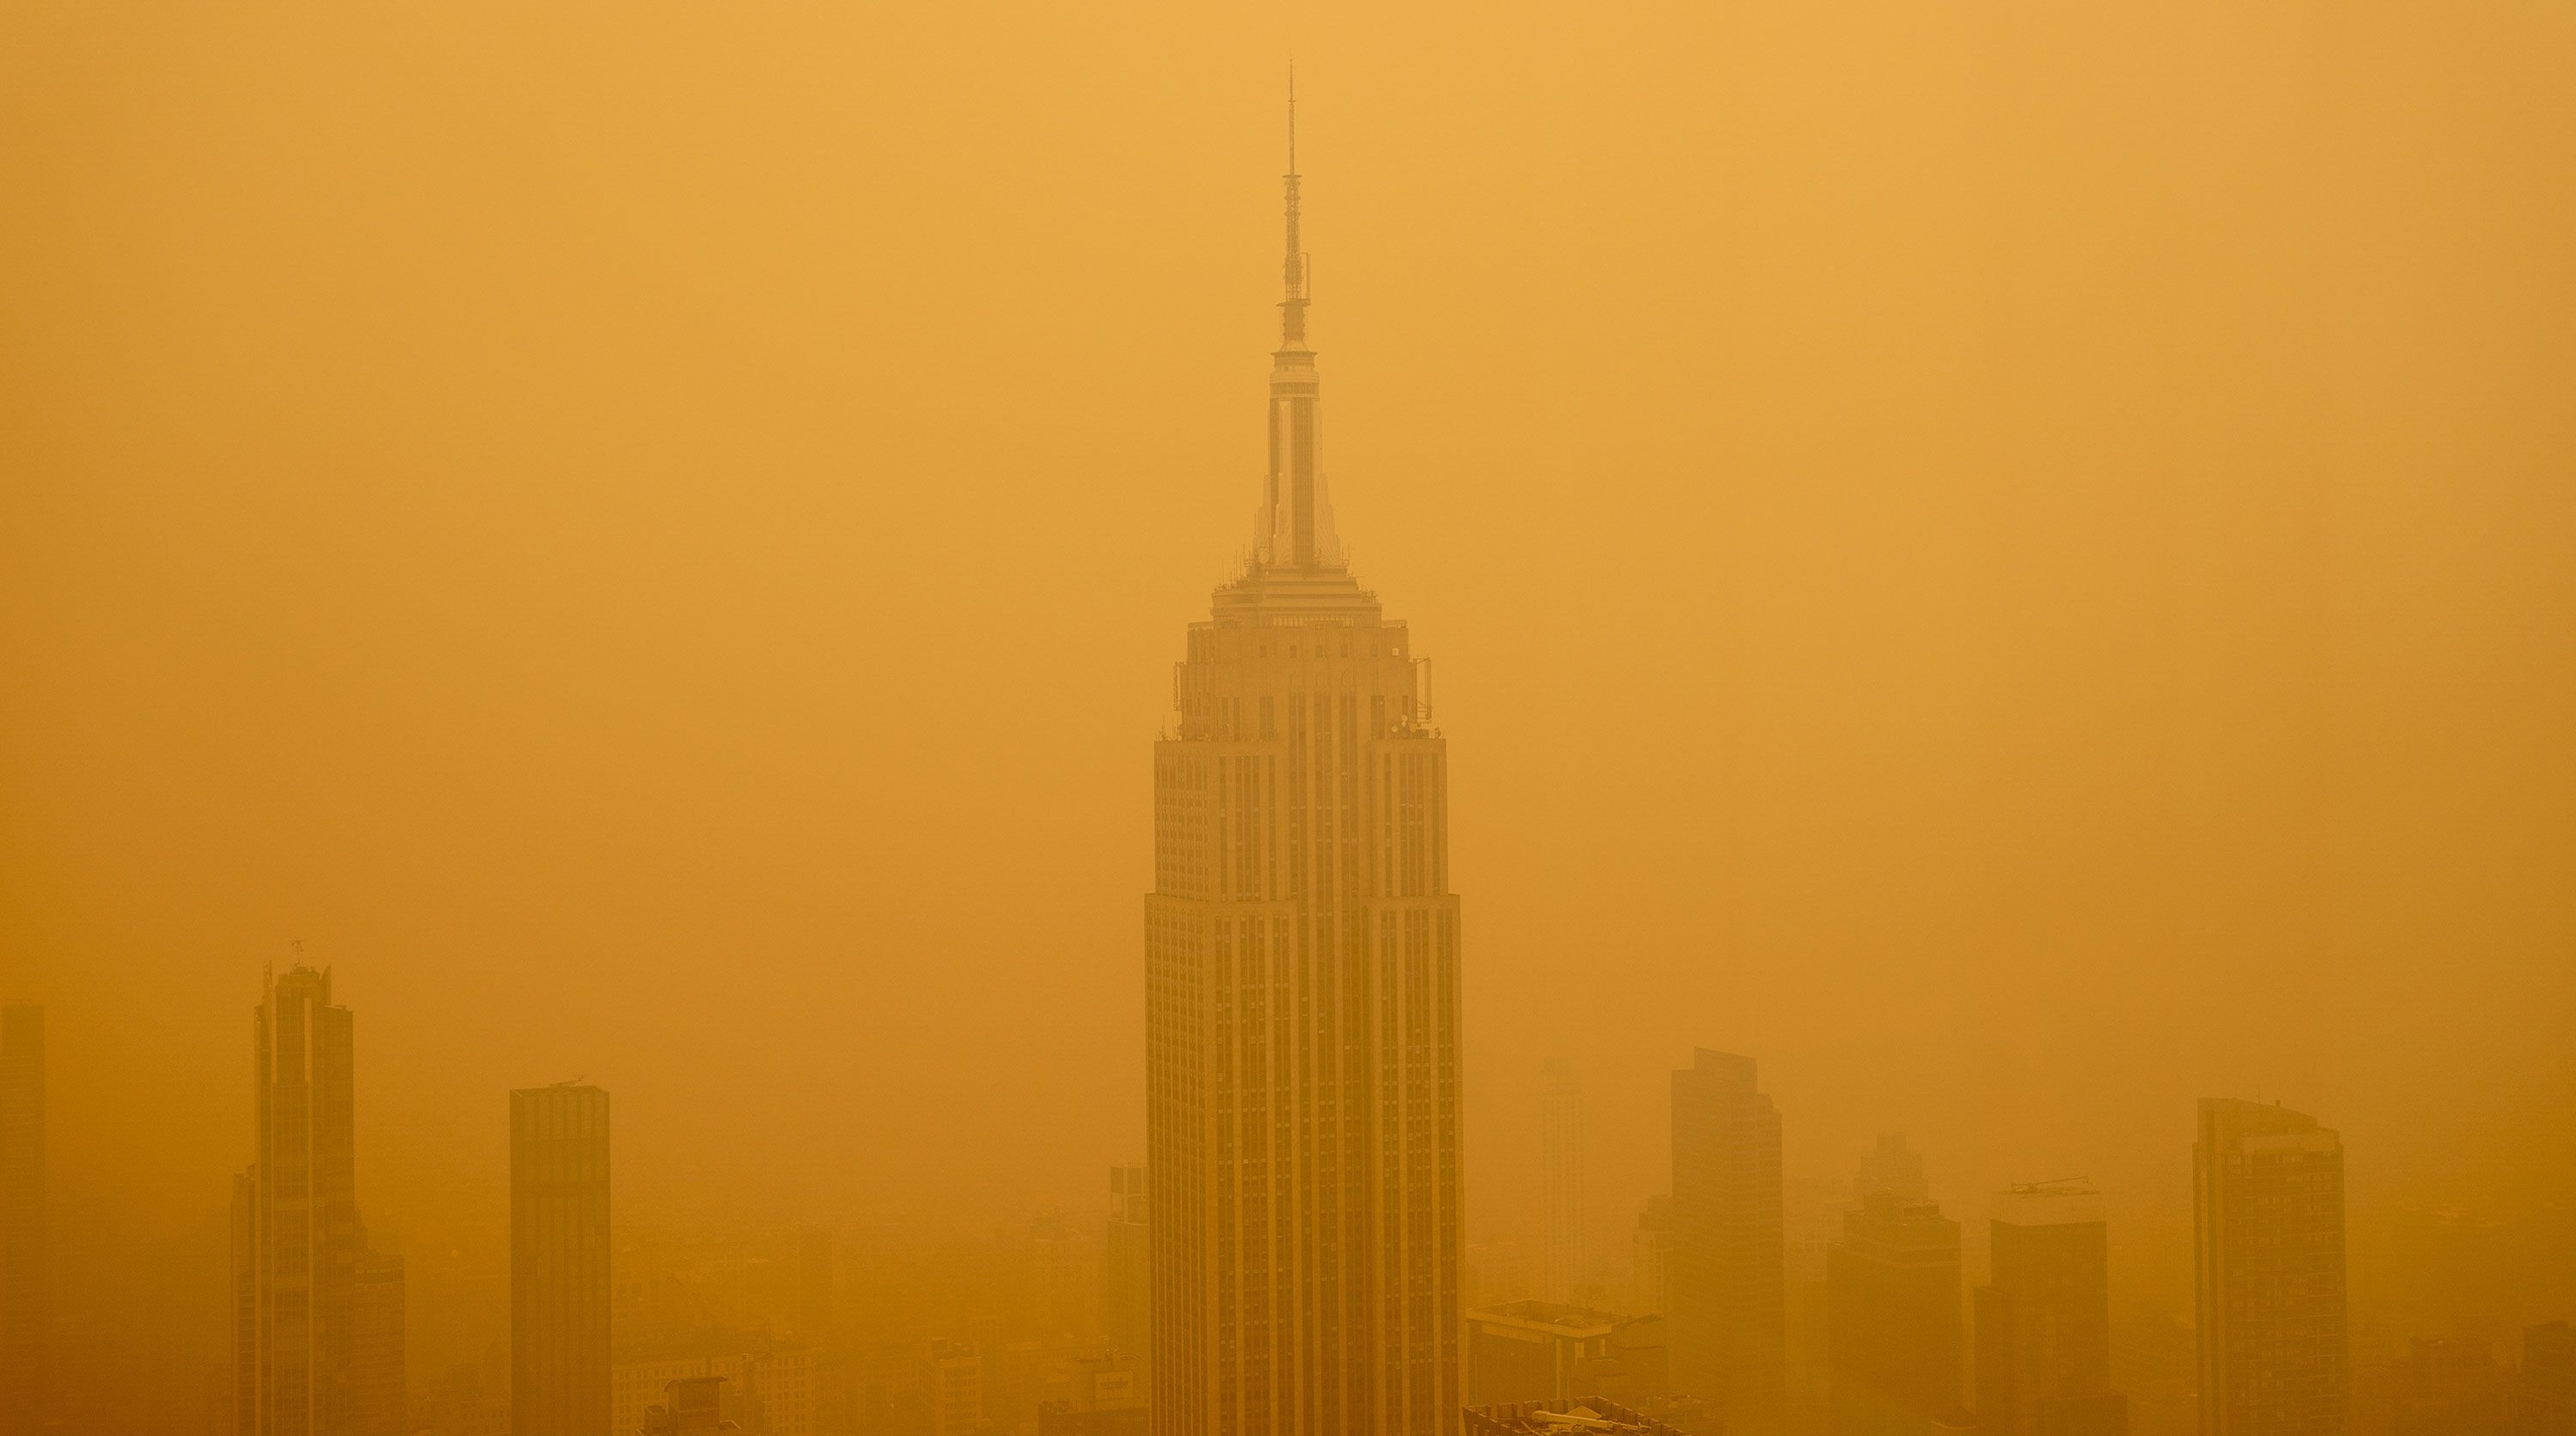
If you were online this past June, you more than likely encountered images of a smog laden New York City – yellow skies, unnatural darkness, and empty streets painting a dystopian backdrop for the typically vibrant city.
The negative impacts of climate change are more apparent and existentially concerning than ever. The smog in New York City and, more critically, the wildfires that caused it are examples of the increasingly frequent and severe climate-related events occurring around the globe. While they merely represent the tip of the iceberg, they also offer a tangible example from which we can provide insights on climate change preparedness and resilience.
A month earlier, 500 miles north of New York in Quebec, intense thunderstorms rolled through the drought-stricken Canadian province, casting bolts of lightning down upon large swaths of the region’s water-deprived vegetation and setting it alight. In short time, what started as smolders turned to massive wildfires that blazed rapidly across the land. According to a NASA press release, the fires burned 600 square miles of forest by June 5 – the average amount over such a period is only a single square mile.1 While unprecedented, the writing was on the wall months prior at the end of winter.
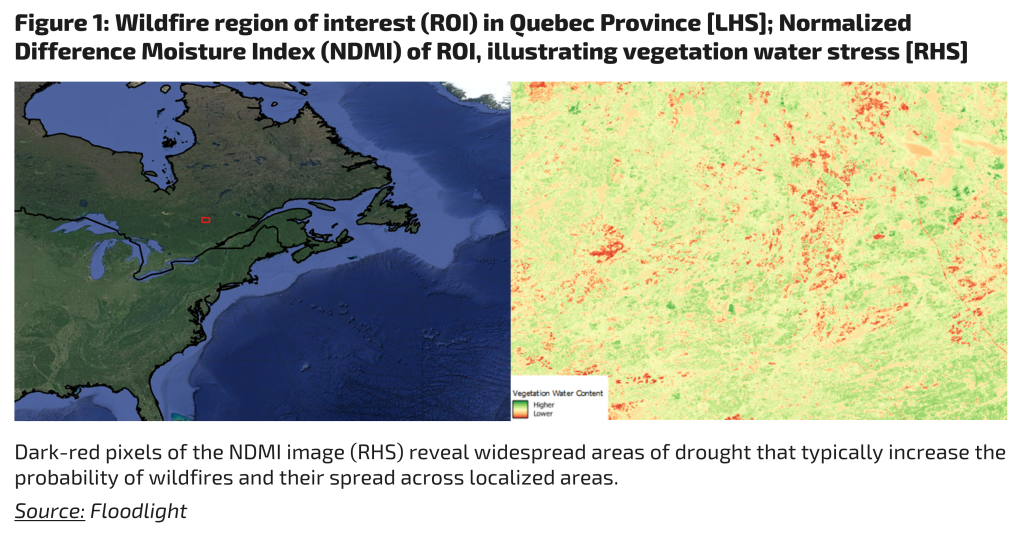
Satellite data reveals many of the precursors that led to 2023 becoming such an extreme year for wildfires. Derived from optical imagery, the normalized difference moisture index (NDMI) provides insight on the drought that fanned the flames. The NDMI is an indicator of how water-stressed vegetation is from lack of precipitation. Figure 1’s lefthand image homes in on the region of interest (ROI) in Quebec that experienced drought. The image on the right, zooms on the ROI with a visualization of NDMI at the beginning of May, highlighting unusually dry areas in dark red; water features in a lighter red, and illustrating healthy vegetation with darker shades of green. As is evident, there is some overlap between burned pixels (Figure 2) and dry pixels, suggesting a connection between water-deprived vegetation and wildfire spread. It is important to note, however, that NDMI is not the sole predictor of a fire as there are burned areas even where the NDMI isn’t abnormally dry. However, drought does make it more likely for a fire to spark, also potentially increasing the rate of spread in certain conditions.
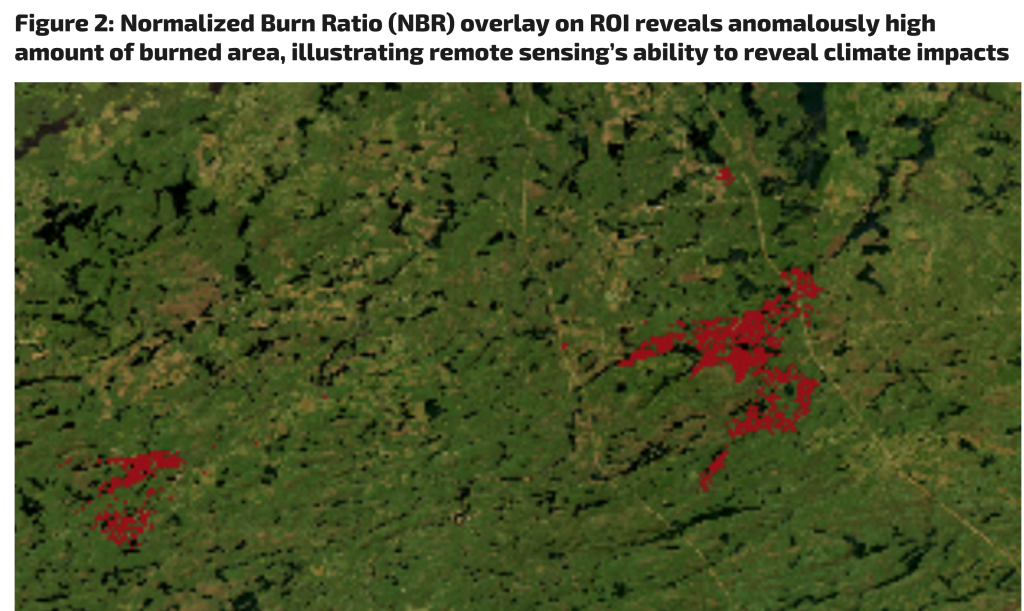
Beyond Figure 1 (RHS), remote sensing also reveals the extent of the burned area, as well as the severity of the damage, via an index known as the normalized burned ratio (NBR). Below, Figure 2 homes in on the same sample of the ROI, highlighting burned land pixels in red, again drawing the connection between the drought and wildfire. As a note, it must be mentioned that the sample is not the only place where the wildfires occurred and that the time constraint of this analysis is solely focused on the month of May.
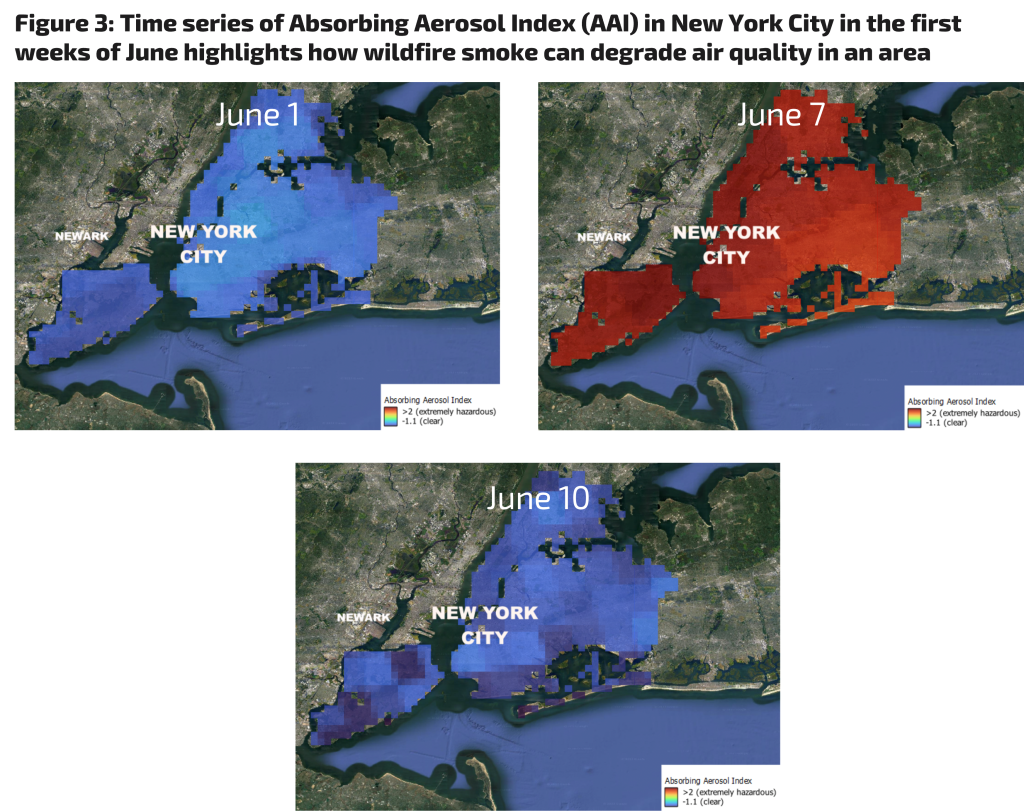
Finally, satellite data also proves essential for understanding the extended impacts of the wildfires – like the smog in New York. The absorbing aerosol index (AAI), for instance, uses satellite data to show the presence of aerosols that absorb light in the UV spectrum, including smoke. When the index is negative, aerosols like smoke are not present, and when it is positive, such aerosols are present. Figure 3 is the result of such analysis, employing data from Sentinel-5p to reveal the nature of the smog that hit New York in June. The extreme high value of June 7, 2023, in NYC correlates to the apocalyptic yellow skies that cast over the city.
The data from this analysis is not only important for understanding the event that occurred, but provides valuable learnings for preparing for future such events. The NDMI can serve as a valuable tool decision makers can use to pinpoint areas at high-risk for wildfires, equipping them with timely data that covers massive spatial extents. Additionally, decision-makers can employ the NBR to estimate biodiversity impacts due to forest losses, enabling the quantification of carbon emissions and the impact on the climate. Beyond this, the NBR is a useful tool for reforestation efforts, providing an understanding as to when an area was affected by fire to inform the timing and scale of forest restoration projects. Finally, the AAI is an essential part of demonstrating the risk that wildfire-related aerosols pose on human health. Although it was not shown in this analysis, other models that show the movement of smoke from wildfires can prepare populations for potential impacts.
In summary, remote sensing technologies like those employed by Floodlight provide valuable insight on the risks and impacts of climate-related events. Floodlight’s mission is to equip public and private sector stakeholders with such insights to drive more intelligent decisions related to climate and health risks.
Citation:
1. Wildfires Scorch Quebec.” NASA, NASA, 6 June 2023