

George Harrison (1968) wrote the song An Octopus Garden that has provided us inspiration to collect our KPIs into one tidy space like the garden in the shade.
I’d like to be under the sea
In an octopus’s garden in the shade
[Verse 3]
Carbon emissions are a major contributor to global climate change, and as such, it is important to measure and track them in order to reduce their impact. Carbon emission KPIs (Key Performance Indicators) are metrics used to measure the amount of carbon dioxide (CO2) emitted by an organization or industry. These KPIs can be used to identify areas of improvement, set goals, and track progress towards reducing emissions. In this blog, we highlight examples for each KPI, that are like the rocks and seashells collected by the octopus in his garden under the sea, as well as highlight current trends to a path to net zero, that should make the investing caring public, happy and safe.
Total Carbon Emissions KPI
This KPI measures the total amount of CO2 emitted by an organization or industry over a given period of time. This provides both Scope 1 and 2 measures. It is typically measured in metric tons of CO2 equivalent (MTCO2e). This KPI can be used to compare emissions between different organizations or industries, as well as track progress over time. Globally, the primary sources of greenhouse gas emissions are electricity and heat (31%), agriculture (11%), transportation (15%), forestry (6%) and manufacturing (12%). Each sector is coming up with its own technologies and paths to net zero moving forward. For example the electric vehicles (EV) sector has captured consumer imagination with most auto manufacturers promising EV models.
Carbon Intensity KPI
What is Carbon Intensity? This KPI measures the amount of CO2 emitted per unit of output (e.g., per unit of energy produced). It is typically measured in metric tons of CO2 equivalent per megawatt-hour (MTCO2e/MWh). This KPI can be used to compare the efficiency of different organizations or industries, as well as track progress over time.
For example, the carbon intensity of a conventional Blast Furnace – Basic Oxygen Furnace production route is highly CO2-intensive (usually with a carbon footprint of 1.6-2.0 tonnes of CO2 per tonne of crude steel produced) while the scrap-based Electric Arc Furnace (EAF) plants can indeed contribute to decarbonisation, reaching near zero emission. But EAF would need a mind shift of both countries and companies that goes beyond business as usual. As noted by OECD, Steel decarbonisation is a global challenge that requires a global response.
Carbon Footprint KPI
Carbon Footprint: This KPI measures the total amount of CO2 emitted by an organization or industry from all sources, including direct emissions from operations and indirect emissions from activities such as transportation and waste disposal. This KPI measures Scopes 1,2, and 3. It is typically measured in metric tons of CO2 equivalent (MTCO2e). This KPI can be used to compare the overall environmental impact between different organizations or industries, as well as track progress over time. For example, we compare the energy use of different foods including fish, eggs, beef, and meat substitutes (such as Beyond Meat) along with a metric called land use describing land requirements needed to produce for 1 kg of protein.
| Metrics | Fish | Eggs | Beef | Meat Substitutes |
| Energy use (MK/kg protein) | 75-610 | 90-100 | 180-280 | 50-290 |
| Global Warming potential (kg CO,-eq/kg protein) | 5-80 | 25-40 | 45-210 | 3-35 |
| Land use (m2/kg protein) | 15-30 | 35-55 | 78-162 | 5-21 |
Table: GHG metrics showing intensity of some agricultural products
Renewable Energy Use KPI
This KPI measures the percentage of energy consumed by an organization or industry that comes from renewable sources such as solar, wind, and hydropower. It is typically measured in percentage points (%). This KPI can be used to compare the use of renewable energy between different organizations or industries, as well as track progress over time.
Renewable energy can be derived from he combustion of separated municipal solid waste (MSW). Currently, there are 75 facilities in the United States that recover energy from MSW. These facilities exist in 25 states, mainly in the Northeast. A typical waste to energy plant generates about 550 kilowatt hours (kWh) of energy per ton of waste. At an average price of four cents per kWh, revenues per ton of solid waste are often 20 to 30 dollars.
Energy Efficiency KPI
This KPI measures how efficiently an organization or industry uses energy resources such as electricity and fuel. It is typically measured in kilowatt-hours per unit output (kWh/unit). This KPI, involving Scope 2, can be used to compare the efficiency between different organizations or industries, as well as track progress over time. There are certified climate bonds in this space.
Greenhouse Gas Emissions KPI
This KPI measures the total amount of greenhouse gases emitted by an organization or industry over a given period of time, including both carbon dioxide and other gases such as methane and nitrous oxide. It is typically measured in metric tons of carbon dioxide equivalent (MTCO2e). This KPI can be used to compare emissions between different organizations or industries, as well as track progress over time. Scope 1 an 2 emissions can be derived from spatialization of the asset on the ground and measurement based on satellite or other data sources. (see Figure)
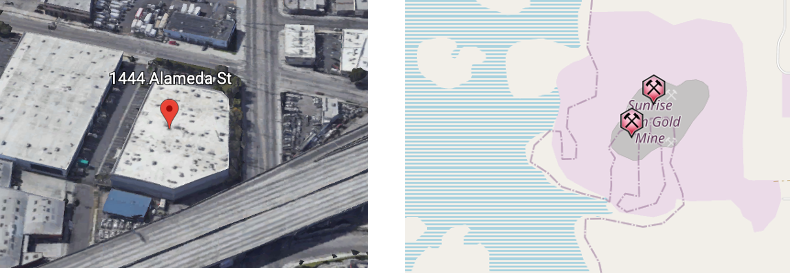
Figure: Two assets – Retail asset in California (left panel) and a gold mine in Western Australia (right)
Waste Reduction KPI
This KPI measures how much waste an organization or industry produces relative to its output level (e.g., how much waste it produces per unit produced). It is typically measured in kilograms per unit output (kg/unit). This KPI can be used to compare waste reduction efforts between different organizations or industries, as well as track progress over time.
Cities and towns face a massive challenge in disposing waste. Certain wastes such as wood and paper products can be recycled. The percent wood recycled in the US in 2018 was around 17.1% out of the Total Materials in Products – recycled which was around 36.4% . For example, Trex® (publicly traded company) manufactures eco-friendly composite decks from a blend of 95% recycled plastic film and reclaimed sawdust. Ikea, the Swedish furniture company, uses about 55% of the renewable, and 17% recycled materials.
—–